(making sense of complex nonlinear graphs)
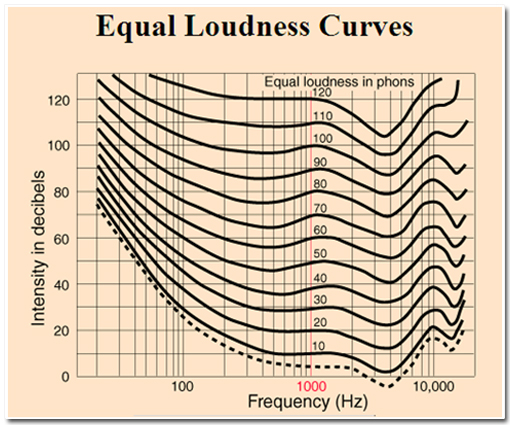
This graphic is introduced to first-year students of audiology and speech therapy and underlies the understanding of some of the most fundamental concepts in the study of the science of human hearing. Students are expected to use it to understand and explain the ways in which the human ear reacts differently under different circumstances.

To make sense of these graphs a student must:
- Understand the conventions of graphical representations of a coordinate plane
- Appreciate that the horizontal scale is not linear and understand the conventions of a logarithmic scale.
- Understand how to interpret the changes in slope of the graphs in terms of variations in rates of change.
- Interpret the implications of the relationships between the different curves in the context of the way the ear responds to sounds of different frequencies.